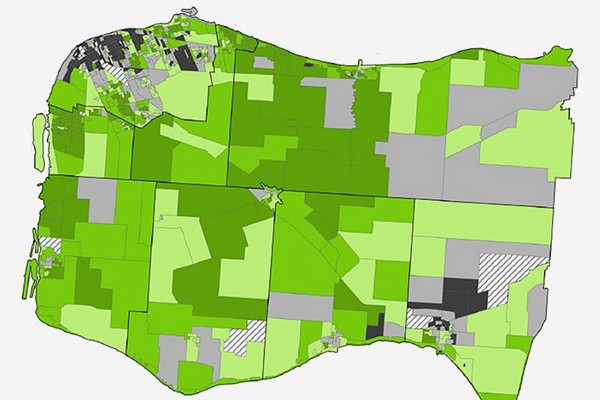
 Maps produced by the Centre for Geospatial Analysis illustrate a report on poverty in Windsor-Essex.
While the Great Lakes Institute for Environmental Research naturally focuses on environmental science, it’s important that it also contributes to the local community, says Alice Grgicak-Mannion.
That’s why her geospatial lab was proud to become involved in a project outside its daily research purview to help the United Way map indicators of poverty in Windsor–Essex for its report, Taking Back our Neighbourhoods.
“We are very proud of the work,” says Grgicak-Mannion, who heads the lab. “The United Way was looking for visual representation of poverty-based indicator data, such as income, immigrant status, single-parent homes, etc., and maps were a great way to do that.”
She and research associate Courtney Spencer produced 68 detailed maps using data from the 2001, 2006 and 2011 censuses, combining socio-economic indicators to identify levels of poverty risk in geographic divisions across the Windsor-Essex region.
“This approach first helps to highlight where areas of poverty risk can or may occur, from there the United Way along with its partners can further drill down and identify individual neighbourhoods in need,” Grgicak-Mannion says. “This helps prioritize specific programs within these neighbourhoods.”
The report notes that poverty has become more concentrated in certain neighbourhoods, and calls for targeting resources to address entrenched and structural issues.
Grgicak-Mannion says her group is currently producing supplementary maps that will provide more detail for specific wards. She also plans to follow up once data is available from this year’s census.
“Who knows, maybe the 2016 census will show shifts in the risk levels as well as changes in the geography of these zones,” she says.